MatDaCs Tool Trial Report: WebPlotDigitizer
1. Introduction
This time, I tried using “WebPlotDigitizer,” a tool listed on MatDaCs. This tool extracts data from images, making it a very convenient tool for digitizing experimental and computational data plots.
2. Tool Overview
Provider: Automeris.io
Purpose: Digitize data from images
Main Features:
- Automatic, semi-automatic, and manual data extraction modes
- User-friendly interface
- Multi-functionality
3. How to Use
3.1 Installation
It can be used as a web application from the official website.
3.2 Basic Operation
- Upload an image
- Define the axes
- Select data points
- Export the data
4. Actual User Experience
4.1 Ease of Use
It has an intuitive interface, making it easy even for beginners to use. The official page also offers easy-to-understand video tutorials.
4.2 Accuracy
Even in automatic extraction mode, it provides high accuracy.
5. Use Case
5.1 Preparing the Image
This time, I tried to read the specific heat data for the one-dimensional Heisenberg model. The data was taken from Fig.8(a) of the paper (K. Ido et al, Comp. Phys. Commun. 298, 109093 (2024)). The raw data for this calculation is also available in the following repository (ISSP Data Repository), so the accuracy of the extracted data can be verified.
5.2 Accessing WebPlotDigitizer
Visit WebPlotDigitizer and click on “Launch App.”
5.3 Uploading the Image
Take a screenshot of the figure from the paper and upload that image.
5.4 Defining the Axes
Select “2D (X-Y) Plot” and define the axes.
5.5 Extracting Data Points
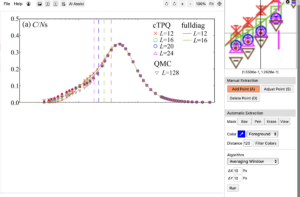
Select data points using “Add point.” You can add points like the figure below. A zoomed-in view will appear in the top-right corner, which you can also use as a reference. This time, I manually extracted the data for L=24 (triangle points).

5.6 Exporting Data
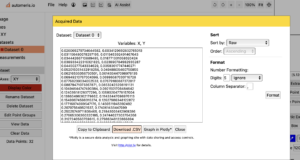
Check the data points and save them in CSV format. The screen looks like this.

5.7 Verifying Data
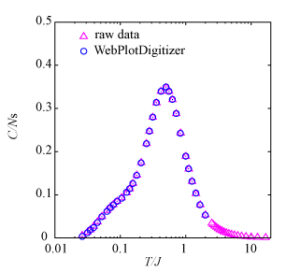
I compared the extracted data with the raw data. As shown in the figure below, the data was extracted with high accuracy.

6. Conclusion
“WebPlotDigitizer” is an excellent tool that can quickly and accurately extract data from graphs and plots. Its intuitive usability and multifunctionality make it extremely useful for research and data analysis. I would like to continue using it actively in the future.
WebPlotDigitizer Official Site

