MatDaCs Tool Trial Report: ImageJ
1. Introduction
This time, we tried using the tool “ImageJ” listed in MatDaCs. In this report, we provide basic information about the tool, its usage, and our actual experience using it.
2. Overview of the Tool
- Tool Name: ImageJ
- Provider: National Institutes of Health (NIH), USA
- Purpose: Image processing software
- Main Features:
- Threshold measurement
- Filtering
- Object counting
- Distance measurement
This time, we focused on summarizing how to count objects using the tool.
3. How to Use
3.1. Installation Procedure
1. We downloaded the software from the official website. https://imagej.net/ij/download.html
3.2. Basic Operations
We primarily used the GUI for operations. Although not used this time, scripting operations are also possible.
- Open an image file via the menu: File -> Open
- Perform preprocessing on the image: Convert it to grayscale via Image -> Type -> 8-bit
- Set a threshold to highlight the objects you want to count: Image -> Adjust -> Threshold, and then press Apply.
- Generate a binary image: After applying the threshold, convert the image to a black-and-white binary image via Process -> Binary -> Make Binary.
- Analyze the objects: Use Analyze -> Analyze Particles. When selecting objects of a certain size or shape, adjust Size and Circularity. To highlight the counted objects, select Overlay Masks under Show.
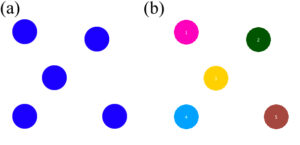
(a): Test image used for object counting.
(b): Results from ImageJ. The tool successfully counted 5 objects.
3.3. Advanced Operations
We tested whether the tool can correctly count objects that overlap.
- Open an image file via the menu: File -> Open
- Perform preprocessing on the image: Convert it to grayscale via Image -> Type -> 8-bit
- Set a threshold to highlight the objects you want to count: Image -> Adjust -> Threshold, and then press Apply.
- Separate overlapping parts (watershed): Process -> Binary -> Watershed
- Analyze the objects: Use Analyze -> Analyze Particles. When selecting objects of a certain size or shape, adjust Size and Circularity. To highlight the counted objects, select Overlay Masks under Show.
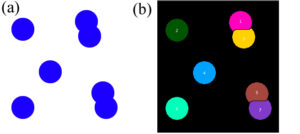
(a): Test image used for object counting.
(b): Results from ImageJ. The tool successfully counted 7 objects.
4. Actual Usage Impressions
4.1. Operating Environment
- OS: MacOS
4.2. Ease of Operation
- It was intuitive to operate using the GUI.
- It was great that overlapping objects could be automatically separated.
4.3. Performance
- Although tested with simple sample images, it worked as expected.
5. Summary
The “ImageJ” tool we tested this time left a strong impression due to its intuitive operation and convenient features, such as automatically separating overlapping parts. I would like to utilize this tool for image processing in future research.